

Six Week Pilot to Prove Digital Signage ROI for Finance

A well-run digital signage deployment returns 20 to 40% ROI in year one and 60 to 150% by year three, but only when you baseline before launch. Retail and QSR locations tend to hit payback in 6 to 12 months; corporate and healthcare deployments run 12 to 24 months. Your priority action before you install a single screen: capture current sales, foot traffic, and staff-time data, then wire your CMS into POS and analytics so every dollar of impact is traceable.
TL;DR:
Precise baseline data from sales, foot traffic, and staff hours must be collected before installation to produce credible ROI claims.
Include all costs such as content creation, maintenance, and energy in the total cost of ownership to avoid undervaluing expenses.
Use controlled tests like A/B comparisons and compare against previous periods to accurately attribute sales lift to digital signage.
Content updates, placement, and content quality are the primary factors affecting ROI variation more than hardware or screen count.
Measuring ROI over at least a full sales cycle, with proof-of-play logs and independent access to analytics, prevents common validity issues.
Table of Contents
What Counts Toward Digital Signage ROI
Most ROI calculations fail before they start, because they leave out half the cost and half the value. Total cost of ownership goes far beyond the screens themselves, and finance will ask about every line item eventually.
Build your cost side from this list:
Discovery and site surveys
Displays, media players, mounts, and enclosures
Freight and installation labor
Cabling, networking, and connectivity fees
CMS licensing (monthly or annual)
Integration work (POS, inventory, scheduling systems)
Content creation and ongoing production
Staff training
Maintenance, spare parts, and eventual decommissioning
Energy costs for always-on displays
On the value side, sort every benefit into one of four buckets: direct revenue (sales lift, average order value increases), operational savings (eliminated print costs, reduced staff time spent updating boards manually), customer experience gains (dwell time, Net Promoter Score movement), and advertising or sponsorship revenue from screen space you sell to other businesses.
Finance teams accept the first two categories almost automatically because they show up in existing reports. The soft metrics need documentation. Track dwell time and satisfaction scores consistently, and treat them as supporting evidence rather than the headline number.
How to Calculate Digital Signage ROI Step by Step
Skipping the baseline is the single most common reason ROI claims fall apart under scrutiny. Before you touch a screen, pull 90 days of POS sales, foot traffic counts, print and signage spend, staff hours spent on manual updates, and any existing NPS data.
Here’s the sequence that produces a number finance will actually sign off on:
Set the baseline window. Ninety days minimum, covering the same season you plan to measure post-launch.
Choose an attribution method. A/B testing and matched-store comparisons are the gold standard: run digital signage in a test location and hold a comparable control location static, then compare sales lift.
When POS integration isn’t available, run a pre/post comparison against the same period one year earlier, and control for known seasonal swings.
Apply the ROI formula. Add attributable incremental benefit to avoided cost, subtract total cost of ownership, then divide by total cost of ownership.
Run sensitivity scenarios. Model conservative, expected, and upside cases using different lift assumptions.
Pro Tip: *Use margin dollars, not revenue dollars, when you calculate attributable benefit.
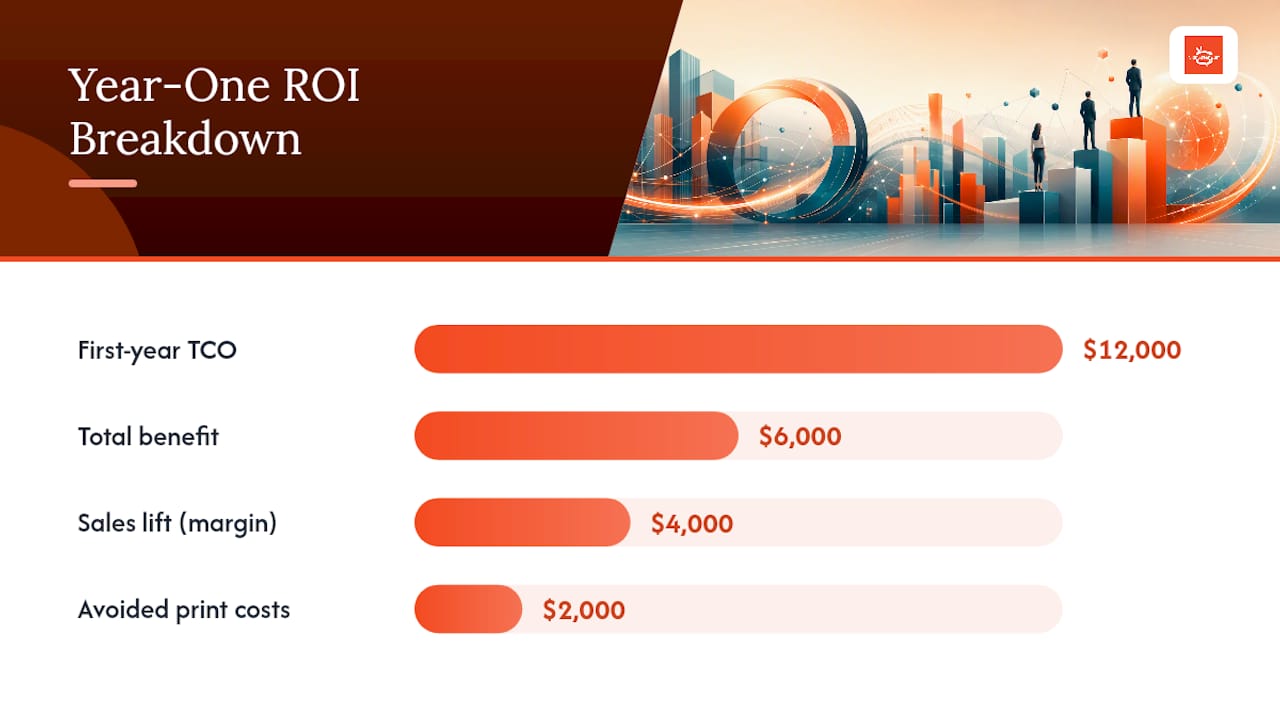
A quick numeric example: a $12,000 first-year TCO deployment drives $4,000 in margin-based sales lift and $2,000 in avoided print costs. That’s $6,000 in benefit against $12,000 in cost, for a 50% year-one ROI, comfortably inside the typical range once you count both revenue and savings.
Your finance deliverable should include a baseline table, a written assumptions list, the sensitivity table, proof-of-play logs, and stated error bounds on your lift estimate.
Digital Signage Benchmarks by Vertical
Averages hide more than they reveal here, because the same hardware performs wildly differently depending on where it sits and what it shows. Still, some patterns hold consistently across deployments:
Retail: promoted-item lifts of 5 to 15%, basket-size increases of 3 to 8%, and the strongest attribution power of any vertical because POS integration ties sales directly to screen exposure.
QSR: menu-board upgrades typically hit break-even fastest, often within 6 to 12 months, driven by upsell prompts at the point of order.
Corporate and wayfinding: returns lean on operational savings rather than sales, with payback stretching to 12 to 24 months.
Healthcare: similar timeline to corporate, with value concentrated in reduced staff interruptions and improved patient wait-time perception.
Venues and hospitality: uplift tracks closely with dwell time. Longer visits mean more screen exposure and more repeat impressions.
A field experiment spanning 237 campaigns and 30 million shoppers found exposure to in-store digital ads raised purchase probability by 8.1% on average, with the effect stronger for hedonic or low-priced items and when signage sat close to the product itself. Placement, margin, and content quality explain most of the variance you’ll see between two identical hardware setups.
Tactics That Actually Move the ROI Number
Content is the single largest driver of ROI variance across deployments, ahead of hardware quality or screen count. Two businesses running identical displays can see wildly different returns based purely on what’s on screen and how often it changes.
Focus your effort on these levers:
Refresh promotional content weekly at minimum, and A/B test different calls to action against each other.
Place impulse-item promotions near checkout or high-dwell zones, where exposure translates fastest into action.
Connect your CMS to POS, inventory, and scheduling systems so content updates automatically match stock levels and peak hours.
Assign clear ownership for content governance, with scheduled audits and uptime monitoring built into someone’s job description, not a side task.
Train staff on basic troubleshooting so a dead screen doesn’t sit dark for a week before anyone notices.
Pro Tip: Before you sell ad space to other businesses through a screen network, run your own promotions for 60 to 90 days first. You need real dwell-time and impression data to price sponsorship inventory credibly, and guessing at rates undersells your own network.
Monetization through sponsorships or an ad exchange works best as a second-phase revenue stream once your core content strategy is already producing measurable lift. Validate the audience numbers internally before you promise them to an advertiser.
Where ROI Measurement Usually Breaks Down
Three mistakes account for most unverifiable ROI claims: skipping the baseline entirely, undercounting TCO by leaving out content production and training hours, and measuring for two weeks instead of a full sales cycle. A fourth, subtler problem is relying on vendor-supplied performance numbers instead of your own control group.
Before you sign a contract, get these items written into the RFP or SLA:
Proof-of-play logs and exportable playback data you can audit independently.
API or CSV access to raw analytics, not just a vendor dashboard summary.
An uptime SLA of at least 99.5%, with defined remedies for downtime.
Spare-parts and RMA commitments in writing.
Clear data retention and ownership terms, so your historical performance data stays yours if you switch platforms.
Test every vendor claim in a real pilot with a control group before committing to a network-wide rollout.
Real Platform Data on Digital Signage Performance
Some digital signage platforms offer real-time content updates across unlimited screens, built-in analytics, proof-of-play tracking, and an ad exchange marketplace, providing the raw data needed for ROI models without separate reporting tools.
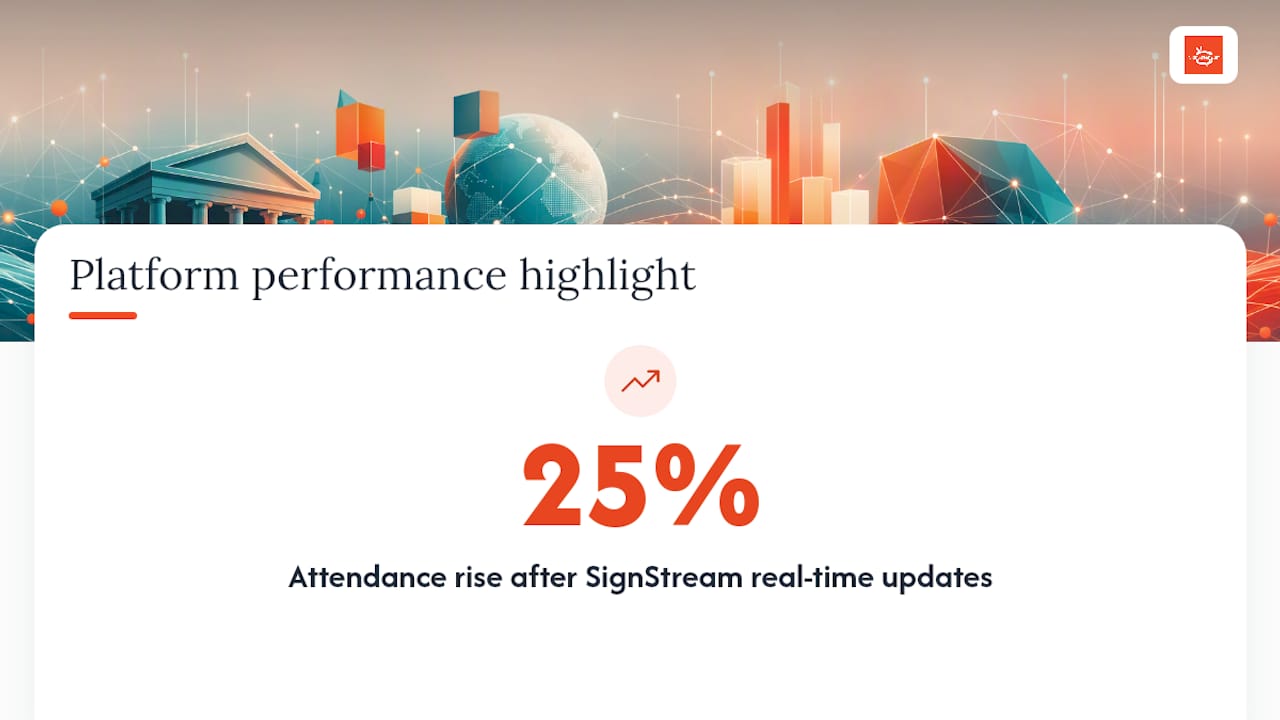
One publisher-reported example: an elite sports club using SignStream saw a 25% rise in class attendance after implementation, a result tied directly to updated class schedules and promotions pushed to screens in real time. Export that kind of platform data straight into your baseline spreadsheet, and you’ve got proof-of-play evidence ready before finance even asks for it.
What I’d Tell You Before You Present This to Finance
Build your case on conservative assumptions, not best-case projections. Attach a baseline spreadsheet, a sensitivity table showing conservative and expected scenarios, and the SLA terms covering uptime and data access. A CFO trusts a modest number backed by evidence over a bold one with none.
— DKS
Running Your Own ROI Pilot With SignStream
Some digital signage platforms are built to support measurement plans that include real-time updates across unlimited screens, built-in analytics, proof-of-play logs, and ad exchange marketplaces that map onto procurement checklists finance departments prefer: exportable data, uptime visibility, and ways to demonstrate attributable value.
Start with a modest pilot: three to five screens for six weeks is enough to establish a baseline, run a matched-location comparison, and generate the proof-of-play evidence your finance team will ask for. Read how the platform works remotely to see the analytics and update tools in action, or check the ad display network if monetizing screen space is part of your plan. If you’re weighing screen count against your current budget line, the cost and TCO breakdown gives you real numbers to plug into your own model before you request a demo.
Sources
FAQ
Is Digital Signage Profitable?
Yes, when measured correctly. Well-run deployments return 20 to 40% ROI in year one, rising to 60 to 150% cumulative by year three, though profitability depends heavily on baselining and full TCO accounting.
What Is a Good ROI for Digital Marketing?
For digital signage specifically, a year-one ROI in the 20 to 40% range is considered solid, with organizations that count all value drivers, including labor savings, averaging closer to 33%.
What Type of Marketing Has the Highest ROI?
Among in-store channels, digital signage placed near the product shows strong returns. Research measuring 237 campaigns and 30 million shoppers found purchase probability rose 8.1% on average with digital ad exposure near the point of sale.
How Big Is the Digital Signage Market?
Market size figures vary by research firm and aren’t consistently reported across sources, but the sustained growth in retail, QSR, and corporate adoption reflects the payback windows and revenue lift documented across verticals in this guide.
How Long Does Digital Signage Take to Pay for Itself?
Retail and QSR deployments typically break even in 6 to 12 months, while corporate and healthcare installations, which lean more on operational savings than direct sales, often take 12 to 24 months.
Recommended
Comments