

How to Track QR Code Scans for Smarter Campaigns
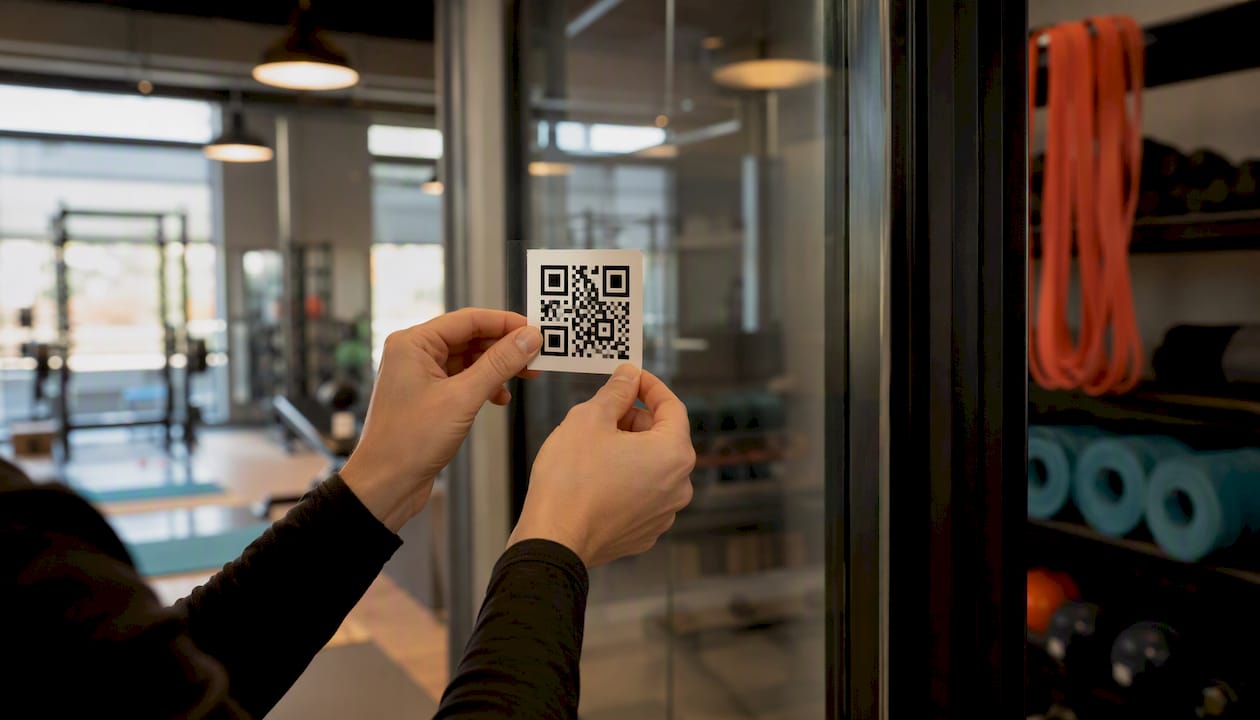
You can track QR code scans by using dynamic QR codes that route every scan through a redirect URL, logging the event server-side before sending the user to your destination. Static QR codes bake the final URL directly into the image, so there is no intermediary server to record anything. Dynamic codes fix that by encoding a short redirect link, and that redirect is what makes tracking possible.
Every scan event typically captures:
Total and unique scan counts (deduplicated by device fingerprint or cookie)
Timestamp (date, time, and time zone)
IP-based geolocation (country and city, not GPS coordinates)
Device type, OS, and browser (parsed from the user agent string)
UTM parameters passed through to your analytics platform
The fastest way to start: build a redirect short link on your domain, append UTM tags, generate a dynamic QR that encodes that short URL, and do a test scan from both Android and iOS before you print anything.
Key Takeaways
Dynamic QR codes with UTM tags and a real-time dashboard are the minimum setup for reliable QR scan tracking across any marketing campaign.
Point | Details |
Dynamic QR codes are required | Static QR codes cannot be tracked; only dynamic (redirect) codes log scan metadata server-side. |
Core metrics are reliable | Scan count, timestamp, device/OS, and city-level geo are dependable; GPS coordinates require explicit user opt-in. |
UTM tags connect QR to GA4 | Appending UTM parameters to your redirect URL passes campaign data directly into Google Analytics or GA4. |
Free tiers have real limits | Most free plans cap monthly scans and retain data for 30–60 days; upgrade when campaigns exceed those bounds. |
Signstream integrates QR with screens | Signstream embeds dynamic QR codes into signage campaigns with per-screen analytics and editable destination URLs. |
Table of Contents
How QR code scan tracking actually works
A static QR code is just an image of a URL. When someone scans it, their phone opens that URL directly, and nothing in between records the event. A dynamic QR code encodes a short redirect URL instead. When someone scans it, their phone hits your redirect server first. That server logs the scan metadata and then issues an HTTP 301 or 302 redirect to the real destination.
The metadata captured at that redirect moment includes:
IP-based geolocation: country and city-level accuracy, derived from the scanner’s IP address. Not GPS, and not precise enough for block-level analysis, but sufficient for regional campaign comparisons.
User agent string: parsed to identify device type (phone vs. tablet), OS (iOS vs. Android), and browser. Accuracy depends on how the platform parses the string.
Timestamp: exact date and time of the scan event, useful for time-of-day and day-of-week analysis.
UTM parameters: any tags you appended to the destination URL pass through the redirect and land in Google Analytics or GA4 as standard campaign dimensions.
Pro Tip: Use a custom domain for your redirect links (e.g., go.yourbrand.com) rather than a generic shortener. Custom domains improve brand trust at the moment of scan, keep your analytics data in your own namespace, and protect continuity if you ever switch QR platforms.
What you can measure — and what you can’t
Knowing which metrics are reliable saves you from making bad decisions on shaky data.
Metric | Typical accuracy / caveats |
Total scans | Highly reliable; every redirect event is logged |
Unique scans | Good approximation; deduplicated by device fingerprint or cookie, but VPNs and cookie clears can inflate counts |
Country from IP | Very reliable for national-level segmentation |
City from IP | Approximate; useful for regional analysis, not precise enough for neighborhood-level targeting |
Device type / OS | Reliable for iOS vs. Android split; tablet vs. phone can occasionally misclassify |
Time of scan | Exact; server-side timestamp is accurate |
GPS coordinates | Not available by default; requires explicit user opt-in and is rarely granted in passive scan flows |
PII (name, email) | Not captured unless the scanner authenticates on the landing page |
Physical campaigns consistently show a high mobile share of scans, which is why device-split metrics matter when you are evaluating QR performance. If your dashboard shows an unexpected desktop share, it usually signals that someone typed the URL manually rather than scanning, which is worth investigating. U.S. Census working papers on device and mobility patterns confirm that mobile device penetration varies meaningfully across demographics and regions, which is why segmenting by device type adds real analytical value to print and out-of-home campaigns.
Premium platforms can layer in GPS-precise coordinates with user consent and set anomaly alerts for scan spikes, but IP-based geolocation remains the default for most tools. Plan your reporting around city-level geo accuracy, and treat GPS data as a bonus when users opt in.
Three practical approaches to tracking QR scans
Choosing the right setup depends on your budget, technical resources, and how tightly you need QR data to connect with your broader marketing stack.
Option A: DIY redirects on your own domain. You build a short redirect endpoint on your server or use a self-hosted URL shortener with logging. Every scan hits your server, you log the metadata to a database, and you query it however you like. The upside is full control and zero vendor dependency. The downside is that it requires development time, hosting, and ongoing maintenance. This path makes sense if you have a developer on staff and need custom integrations.
Option B: Dedicated QR tracking platforms. These tools give you a dashboard, CSV export, UTM passthrough, and often a free tier within minutes of signing up. Typical analytics include total and unique scans, geographic heatmaps, device breakdowns, and exportable raw logs. The tradeoff is monthly scan caps on free plans, potential vendor lock-in if you use their generic short domain, and recurring costs as your campaigns scale.
Option C: Digital signage platforms with native QR support. If your marketing runs across physical screens, a platform like Signstream embeds dynamic QR generation directly into your signage workflow. You manage QR codes alongside screen content, assign them to specific placements, and view scan data in the same dashboard where you manage campaigns. This is the most efficient path when QR codes are part of a broader screen-based advertising strategy rather than a standalone tactic.
Quick checklist to choose your path:
Need full data ownership and custom integrations? Go DIY.
Running a standalone digital campaign with limited budget? A QR platform’s free or entry-level tier works.
Managing QR codes across multiple screens, locations, or ad campaigns? A digital signage platform with native QR support saves significant time.
Require a custom domain for brand consistency? Confirm support before committing to any vendor.
Pro Tip: For A/B tests, create distinct short slugs per creative or location (e.g., go.yourbrand.com/promo-gym-a vs. /promo-gym-b) pointing to the same landing page. You get clean per-variant scan counts without splitting your destination page analytics.
Step-by-step setup for a trackable QR code
Follow this checklist end-to-end before you print or display anything.
Define your destination and KPIs. Decide exactly where the QR sends users and what you are measuring: scan volume, conversion rate, geographic reach, or device mix.
Build your redirect short link. Use a custom domain if possible. The short link is what the QR encodes, and it is what your server logs.
Add UTM parameters. Append utm_source, utm_medium, and utm_campaign at minimum. For multi-location campaigns, add utm_content to identify the specific placement.
Generate a dynamic QR code. Input the short URL, not the final destination. This is what keeps the code editable after printing.
Test from multiple devices. Scan from both iOS and Android, check redirect latency, confirm UTM parameters appear correctly in GA4, and verify the landing page renders well on a small screen.
Deploy and monitor. Set your date range, enable CSV export or webhooks, and check back within 48 hours to confirm data is flowing.
Ongoing monitoring checklist:
Compare unique vs. total scans to spot repeat scanners or bot traffic
Segment by city and time of day to identify peak engagement windows
Export raw scan logs to your BI tool or Google Sheets for deeper analysis
Check device split early; a high desktop share on a print campaign usually means something is off
Pro Tip: Before finalizing any printed material, test the QR code on a low-signal network (LTE, not Wi-Fi) and at the actual scan distance you expect in the field. Redirect latency that feels fine on a fast connection can frustrate users in a busy retail environment.
Free vs. paid: what each tier actually gives you
Free tiers are a reasonable starting point, but they come with real constraints. Free plans commonly include one or more dynamic codes with limited monthly scans and a short data retention window; paid tiers add longer history, CSV and webhook access, custom domains, and higher scan quotas.
Key differences at each level:
Free: basic scan count and device breakdown, short retention (typically 30–60 days), generic short domain, monthly scan cap
Paid entry: longer history, CSV export, custom domain support, higher scan quotas, email alerts
Paid advanced: raw webhook access, GPS opt-in features, multi-location reporting, SLA guarantees on redirect performance, white-label options
Upgrade triggers worth watching for:
Your campaign is approaching the monthly scan cap and the month is not over
You need raw CSV or webhook data to feed a BI tool or CRM
Your brand requires a custom domain on every redirect link
You are running campaigns across multiple retail or franchise locations and need per-location reporting
You need data retained beyond 60 days for quarterly or annual analysis
Many platforms price by the number of active dynamic codes or by monthly scan volume. Before you commit, estimate your expected impressions per month and check whether the plan’s cap covers a busy campaign period, not just an average month.
Privacy, data retention, and U.S. legal considerations
Most QR scan analytics are based on server logs: IP address, user agent, and timestamp. That data is typically anonymous because it does not identify a specific individual on its own. The legal picture shifts when you pair scan data with PII collected on the landing page, or when you use GPS-level location data that requires explicit opt-in.
Key points for U.S.-based campaigns:
CCPA/CPRA in California: if your landing page collects personal information from California residents, you have disclosure and deletion obligations. Consult legal counsel if you are collecting anything beyond anonymous server logs.
Server-side redirect logging does not set cookies on the scan itself. Cookies and consent requirements enter the picture on the landing page, particularly if you are running GA4, Meta Pixel, or similar tags.
GPS-precise location data requires explicit user opt-in and is rarely appropriate for passive scan flows. Premium platforms that offer GPS tracking make this opt-in requirement clear.
Data retention: keep only what you need, document your retention policy, and build a deletion process if any PII is collected downstream.
This article provides general information only. For campaigns that collect PII or use GPS-level location data, consult qualified legal counsel to confirm compliance with applicable U.S. state and federal laws.
Best practices to improve scan rates and data quality
Good QR analytics start with a code that actually gets scanned. Design and placement decisions affect both scan volume and the reliability of your data.
Size and contrast: print QR codes at a minimum of 1 inch × 1 inch for close-range scanning; larger for signage viewed from more than 3 feet. High contrast between the code and background is non-negotiable.
Quiet zone: maintain a clear white border around the code. Crowding it with text or graphics causes scan failures.
Placement height: position codes between 3 and 5 feet from the floor so they are reachable without crouching or stretching.
Avoid reflective surfaces: glass, glossy paper, and backlit panels can cause scan failures. Matte finishes work better in most environments.
Clear CTA: place a short, benefit-driven call to action directly above or below the code. “Scan for today’s menu” outperforms a bare QR with no context.
UTM hygiene: use unique slugs per creative and location. Combining multiple placements under one code makes it impossible to know which placement drove results.
Mobile UX check: confirm the landing page loads in under 3 seconds on mobile and does not require pinching or horizontal scrolling.
Pro Tip: Use short-lived dynamic codes for time-sensitive offers (a weekend promotion, a flash sale) and persistent dynamic codes for evergreen links like menus or loyalty sign-ups. Keeping evergreen codes persistent preserves your scan history and lets you compare performance across months without resetting your baseline.
For restaurant and hospitality operators, QR-based waitlist setups are a practical example of how scan analytics feed directly into operational workflows, not just marketing reports.
What Signstream has learned from QR codes on digital signage
The most common mistake we see is treating QR codes as a one-time print decision rather than a live campaign asset. When a QR code is embedded in a digital signage workflow, you can update the destination URL without reprinting anything, assign different codes to different screens, and see exactly which placement drove each scan. That level of granularity changes how you allocate screen time and ad spend.

A fitness operator running a class promotion across lobby screens, for example, can assign a unique QR code to each screen location. After 72 hours, the scan data shows which screen drove the most sign-ups. The underperforming screen gets a content update; the high-performing placement gets more schedule time. No guesswork, no waiting for a campaign to end before you learn anything.
The tighter the loop between screen content, QR scan data, and campaign scheduling, the faster you can move. Signstream’s QR code tactics for digital signage are built around exactly that feedback loop. Centralized management also means you can run an ad exchange across your screen network, letting partner businesses place ads on your screens while you earn revenue that offsets your signage costs.
The broader trend toward richer product-level digital data, reflected in initiatives like the EU Digital Product Passport, points in the same direction: every physical touchpoint is becoming a data source. QR codes on screens are one of the most practical ways to close that loop today.
Signstream gives you QR tracking built into your screen campaigns
Most QR tracking tools treat the code as a standalone asset. Signstream treats it as part of your screen campaign, which means your scan data, content schedule, and ad performance all live in one place.
With Signstream, you get dynamic QR generation, a real-time scan dashboard, CSV export, custom domain support, and direct integration with your digital signage campaigns. Assign QR codes to specific screens, update destination URLs without reprinting, and use interactive ad workflows to embed QR activation inside paid placements. The ad display network lets you monetize your screens while running your own campaigns, so your signage investment pays for itself. Visit Signstream to see how the platform works and start a trial.
Sources
Recommended
Comments